AIStore as a Fast Tier Storage Solution: Enhancing Petascale Deep Learning Across Remote Cloud Backends
The challenges associated with loading petascale datasets, crucial for training models in both vision and language processing, pose significant hurdles in the field of deep learning. These datasets, often hosted on various cloud backends, add complexity to the training process. Existing cloud storage solutions are increasingly seen as too expensive and/or slow to handle petascale training.
A big part of the problem is that machine learning workloads (training in particular) require random access to a vast (and growing) amount of unstructured data. Random access to a petabyte of data without having a petabyte of RAM at your disposal (or some sort of other fast cache) is difficult. As a result, storage often becomes the primary bottleneck for contemporary machine learning (Ref.).
To solve precisely this problem, we have built AIStore (AIS). AIS is a lightweight, fully open-source, fully reliable storage that can be ad-hoc deployed anywhere from a single Linux machine to a bare-metal cluster of any size.
This blog provides AIS benchmarks and analysis. We compare “with” and “without” AIStore performance metrics in accessing Cloud datasets.
AIS features linear scalability with each added storage node - in fact, with each added drive. Our testing indicates that deploying an AIS cluster within the same data center as compute servers not only delivers high per-GPU throughput but also ensures stable latencies with minimal jitter. Additionally, AIS significantly reduces the total cost by eliminating data egress fees from cloud providers.
Background and Requirements
AIStore’s essential prerequisite is a Linux machine with disks. While not a requirement, a managed Kubernetes (K8s) environment is highly recommended to streamline deployment and management. Direct deployment on bare-metal instances is possible, but managed K8s is advised for efficiency and ease of use given the complexities associated with K8s management.
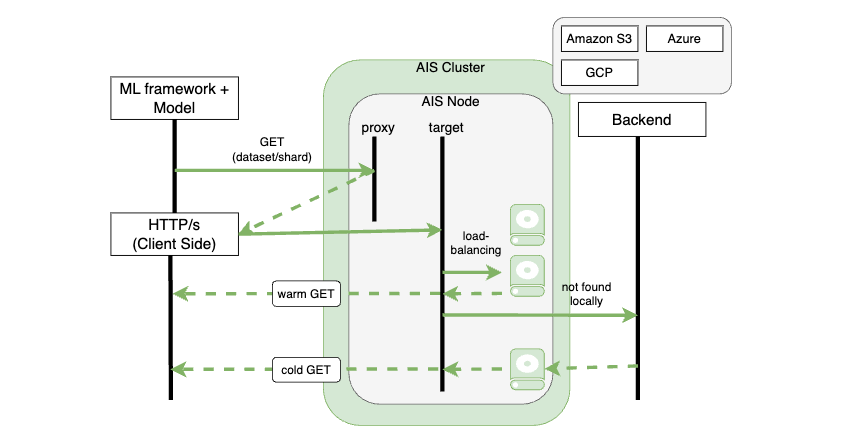
In an AIS cluster, proxies (gateways) and targets (storage nodes) efficiently manage data requests from clients. When a client issues a GET request, a proxy, chosen randomly or specifically for load balancing, directs the request to an appropriate target based on the current cluster map. If the target has the data, it’s directly sent to the client — a ‘warm GET’. For unavailable data, AIS executes a ‘cold GET’, involving a series of steps: remote GET through the vendor’s SDK, local storage of the object, validation of checksums for end-to-end protection (if enabled), storage of metadata (both local and remote, such as ETag, version, checksums, custom), making the object visible (only at this stage), and finally, creating additional copies or slices as per bucket properties, like n-way replication or erasure coding.
This architecture is particularly advantageous for multi-epoch training on large and super-large datasets. During the first epoch, data objects are cached onto the disks, enabling direct and swift access in subsequent epochs, thereby significantly enhancing overall performance.
Benchmark: Setup and Configuration
Recently, we conducted benchmarks of AIS on Oracle Cloud Infrastructure (OCI). Our setup utilized AIStore’s Kubernetes deployment, managed by the Oracle Kubernetes Engine (OKE) running Kubernetes version 1.26.7. The benchmarks involved two configurations: a 3-node and a 10-node cluster, each employing BM.DenseIO.E4.128 instances on OCI.
| Specification | Details |
|---|---|
| OCPU Cores | 128 |
| Memory | 2 TB |
| NVMe Drives | 8 drives (54.4 TB total) Samsung PM1733 |
| Network Interface Card | 50 Gbps |
| OS (Kernel) | Linux (5.15.0-104.119.4.2.el8uek.x86_64) |
It’s important to note that while AIS in this context doesn’t demand extensive CPU and memory resources (in fact, during our benchmarks we never observed CPU utilization exceeding 5%), other scenarios like resharding or ETL may have different requirements.
Parallel to this, the clients utilized aisloader, a load generator for benchmarking AIS and other S3-compatible backends. For the 3-node cluster, we deployed 6 clients (6 separate DenseIO.E4 machines), each running 50 workers, totaling 300 workers. For the 10-node cluster, the setup included 10 clients with 100 workers each for a total of 1000 workers. Each worker in every aisloader performed 1MB and 10MB read requests - from AIS or directly from S3. For testing, we utilized the aisloader-composer tool, a suite of scripts and Ansible playbooks, enabling the benchmarking of an AIS cluster across multiple hosts with aisloader, orchestrated by Ansible.
Summary of Performance Metrics
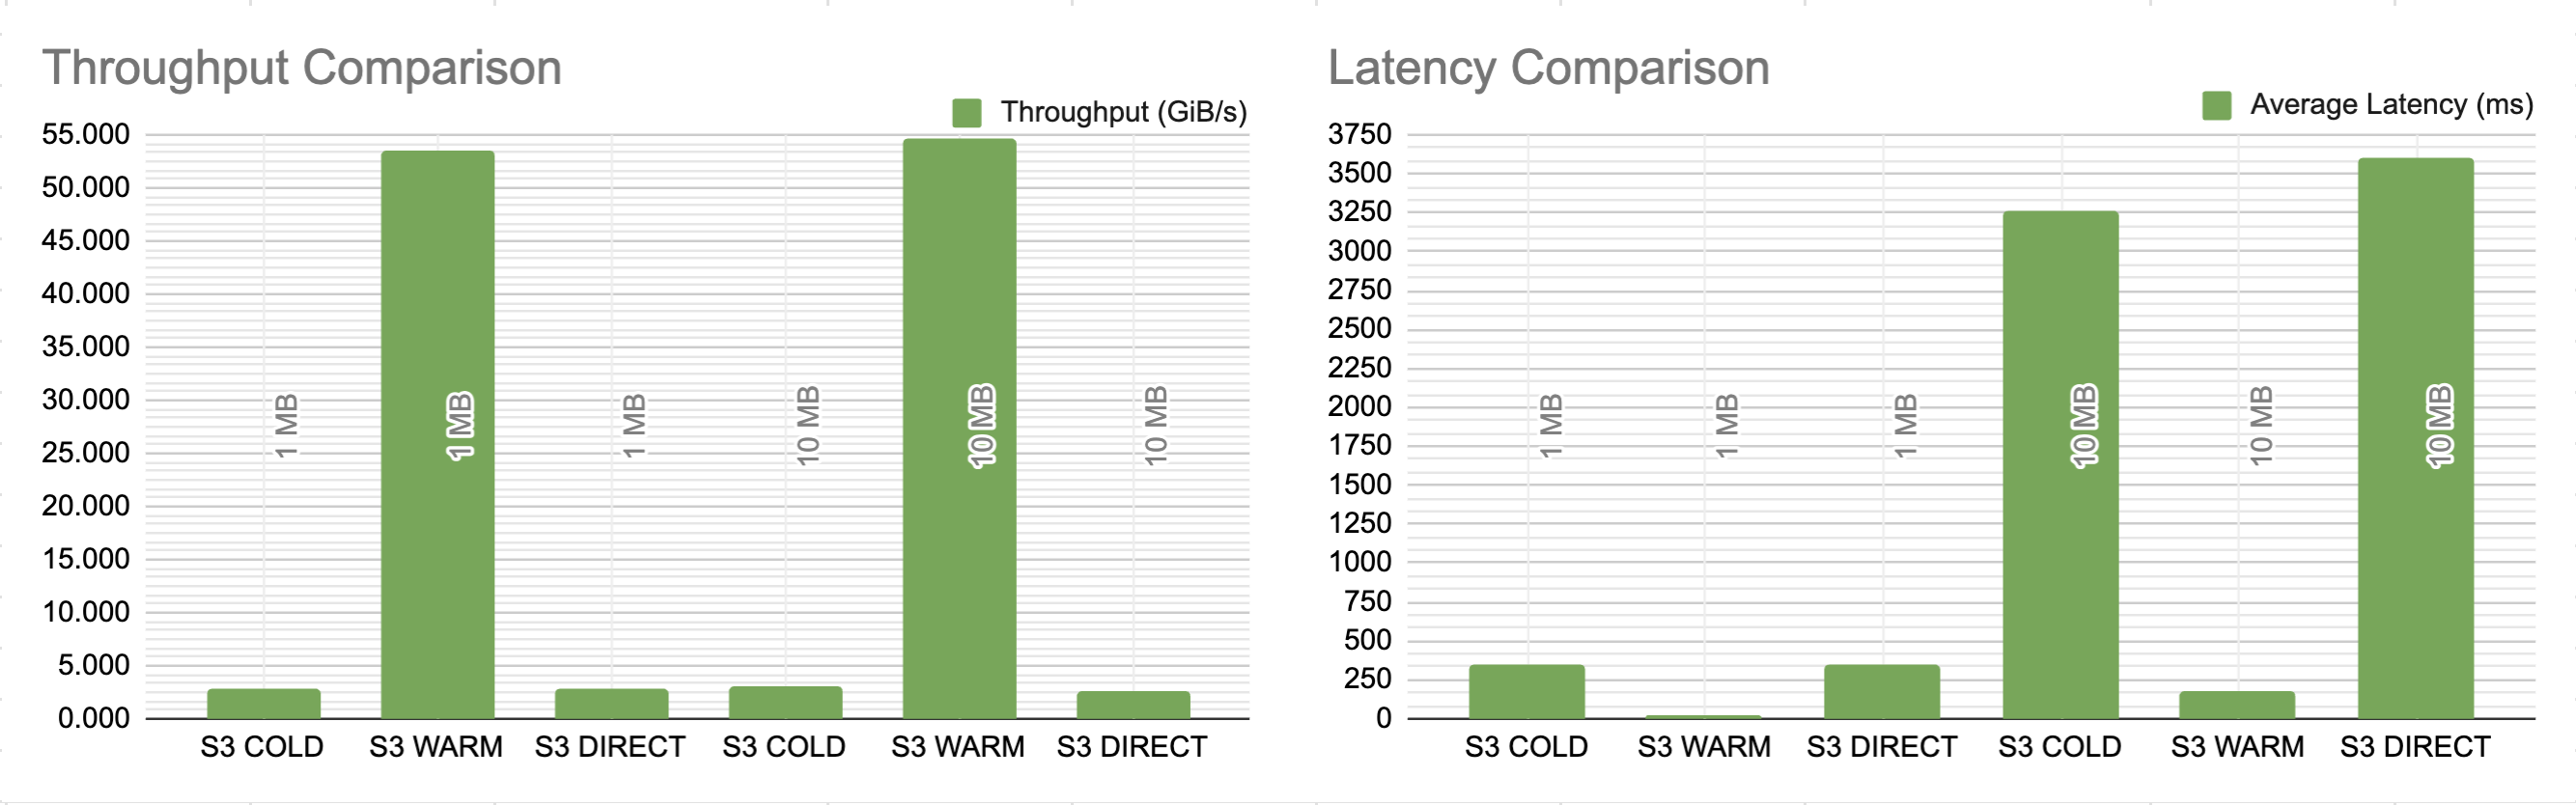
Below, we present a detailed comparison of throughput and latency in different scenarios. We tested direct data retrieval from S3 without AIS (‘S3 DIRECT’), as well as initial (‘S3 COLD through AIS’) and subsequent (‘S3 WARM through AIS’) accesses through AIS where S3 was a backend.
The tests were conducted with 1 MB and 10 MB object sizes. The table outlines throughput in GiB/s and average latency in milliseconds. For AIS scenarios, it also includes average disk utilization, shedding light on the efficiency of data retrieval and processing.
3-Node AIS Cluster Performance with 300 Client Workers
Cluster:
- 3 gateways, 3 targets
- 24 NVMe disks, total raw capacity of 149 TB
Bench Client:
- 6
aisloaderclients (DenseIO.E4 machines), each with 50 workers, totaling 300 workers
Results:
| GET from/how | Object Size | Throughput (GiB/s) | Latency Avg (ms) | Avg. Disk Util.(%) |
|---|---|---|---|---|
| S3 COLD through AIS | 1 MB | 1.080 | 264.388 | 1 |
| S3 WARM through AIS | 1 MB | 16.450 | 17.793 | 20 |
| S3 DIRECT | 1 MB | 1.480 | 197.243 | n/a |
| S3 COLD through AIS | 10 MB | 2.260 | 1291.5 | 1 |
| S3 WARM through AIS | 10 MB | 16.520 | 177.234 | 20 |
| S3 DIRECT | 10 MB | 2.640 | 1108.5 | n/a |
10-Node AIS Cluster Performance with 1000 Client Workers
Cluster:
- 10 gateways, 10 targets
- 80 NVMe disks, total raw capacity: 496 TB.
Bench Client:
- 10
aisloaderclients (DenseIO.E4 machines), each running 100 workers, totaling 1000 workers.
Results:
| GET from/how | Object Size | Throughput (GiB/s) | Latency Avg (ms) | Avg. Disk Util.(%) |
|---|---|---|---|---|
| S3 COLD through AIS | 1 MB | 2.780 | 350.823 | 1 |
| S3 WARM through AIS | 1 MB | 53.550 | 18.22 | 96 |
| S3 DIRECT | 1 MB | 2.750 | 353.979 | n/a |
| S3 COLD through AIS | 10 MB | 2.980 | 3257.3 | 1 |
| S3 WARM through AIS | 10 MB | 54.680 | 178.386 | 97 |
| S3 DIRECT | 10 MB | 2.610 | 3599.8 | n/a |
Performance Analysis and Network Insights
In our study, two key observations emerged, highlighting the performance and efficiency of AIStore.
Linear Scalability Correlated with Storage Nodes
Our first observation concerns the correlation between performance and number of target nodes in a cluster.
In the 3-node setup with 300 workers and 24 NVMe drives, we achieved a throughput of 16.5 GiB/s or 47.2 Gb/s per node. Similarly, in the 10-node setup with 100 workers and 80 drives, the throughput was around 54.68 GiB/s or 47.0 Gb/s per node. This consistency in per-node throughput across different configurations strongly suggests that AIStore’s performance scales linearly with each additional target node. Disk read performance sits around 704 MiB/s for the 3-node cluster and 700 MiB/s for the 10-node, implying linear scaling but coming far short of the performance capabilities of the NVME drives. The limiting factor turns out to be the 50 Gb/s network capacity of the network interfaces on each node -- more on that later.
Initially, disk utilization for WARM GET is high (97%), but it decreases as aisloader clients fetch more objects, storing them in Linux’s Page Cache. The accompanying graph of Throughput vs. Disk Read illustrates this trend: as objects are cached, disk reads diminish, leading to lower disk utilization.
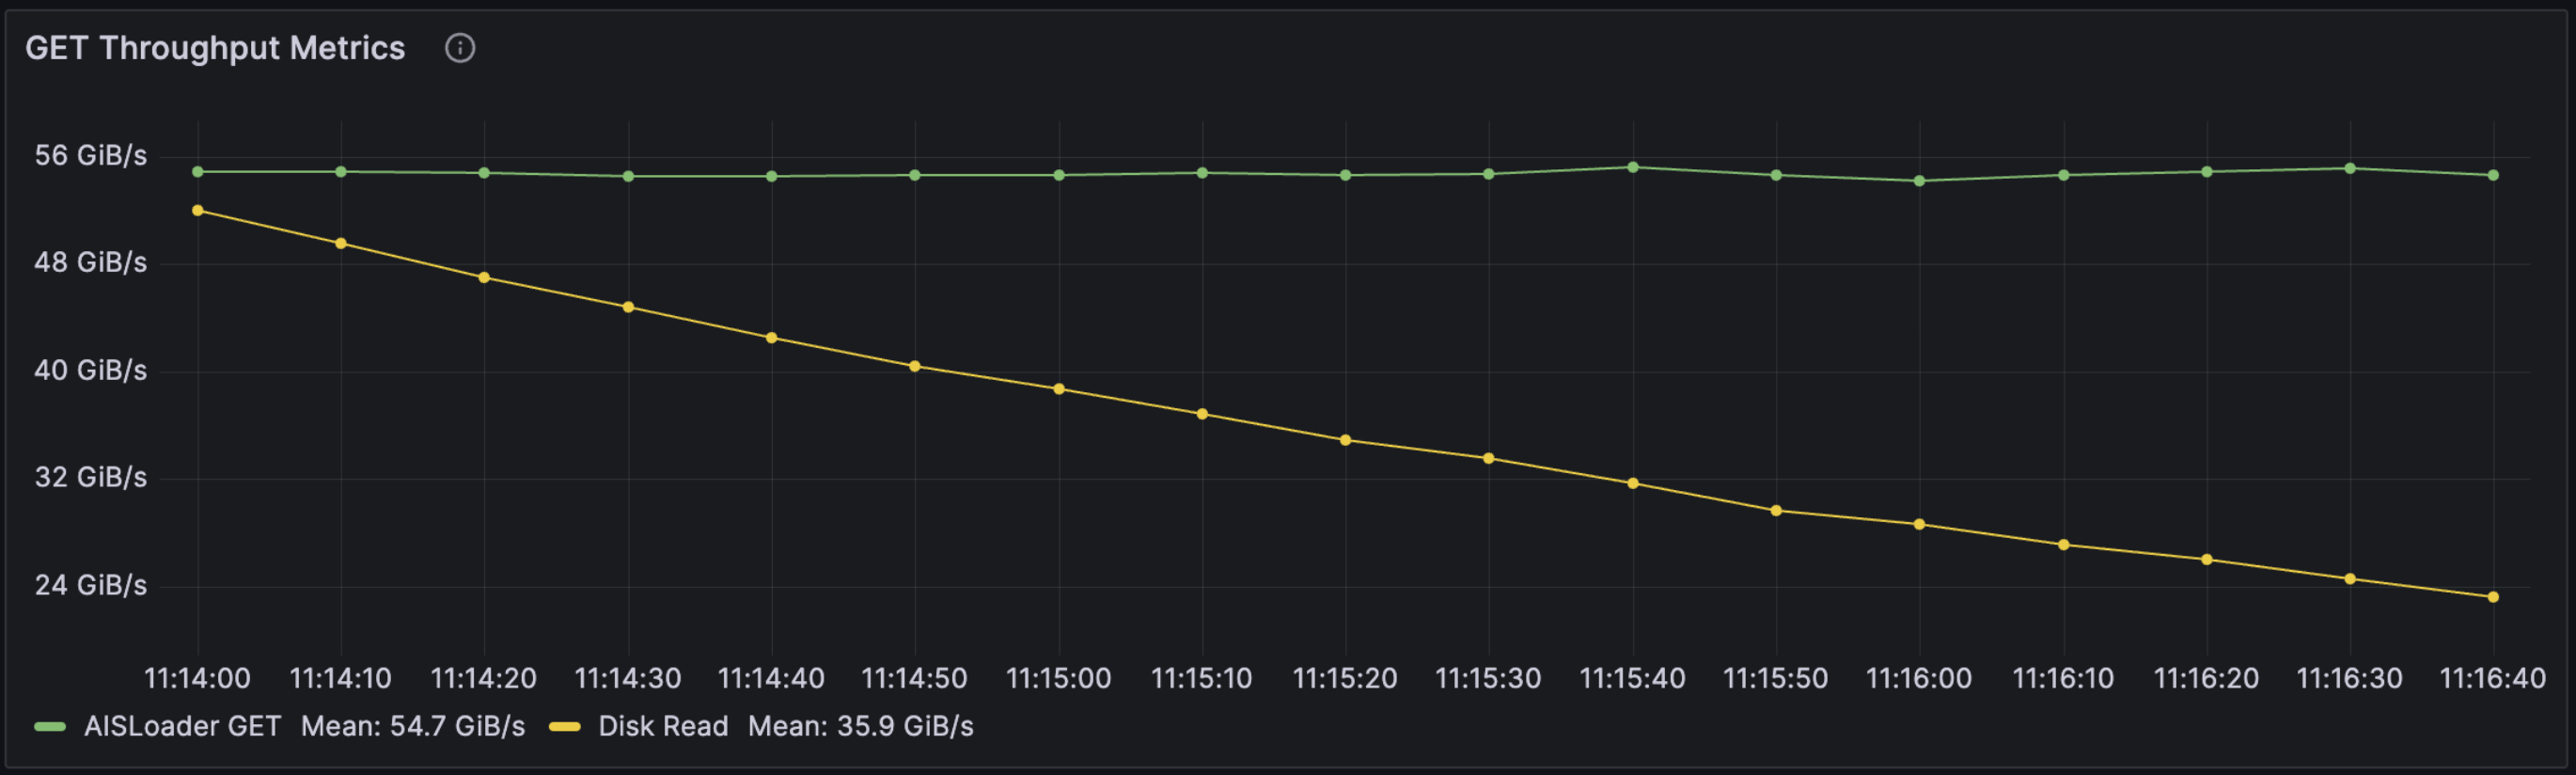
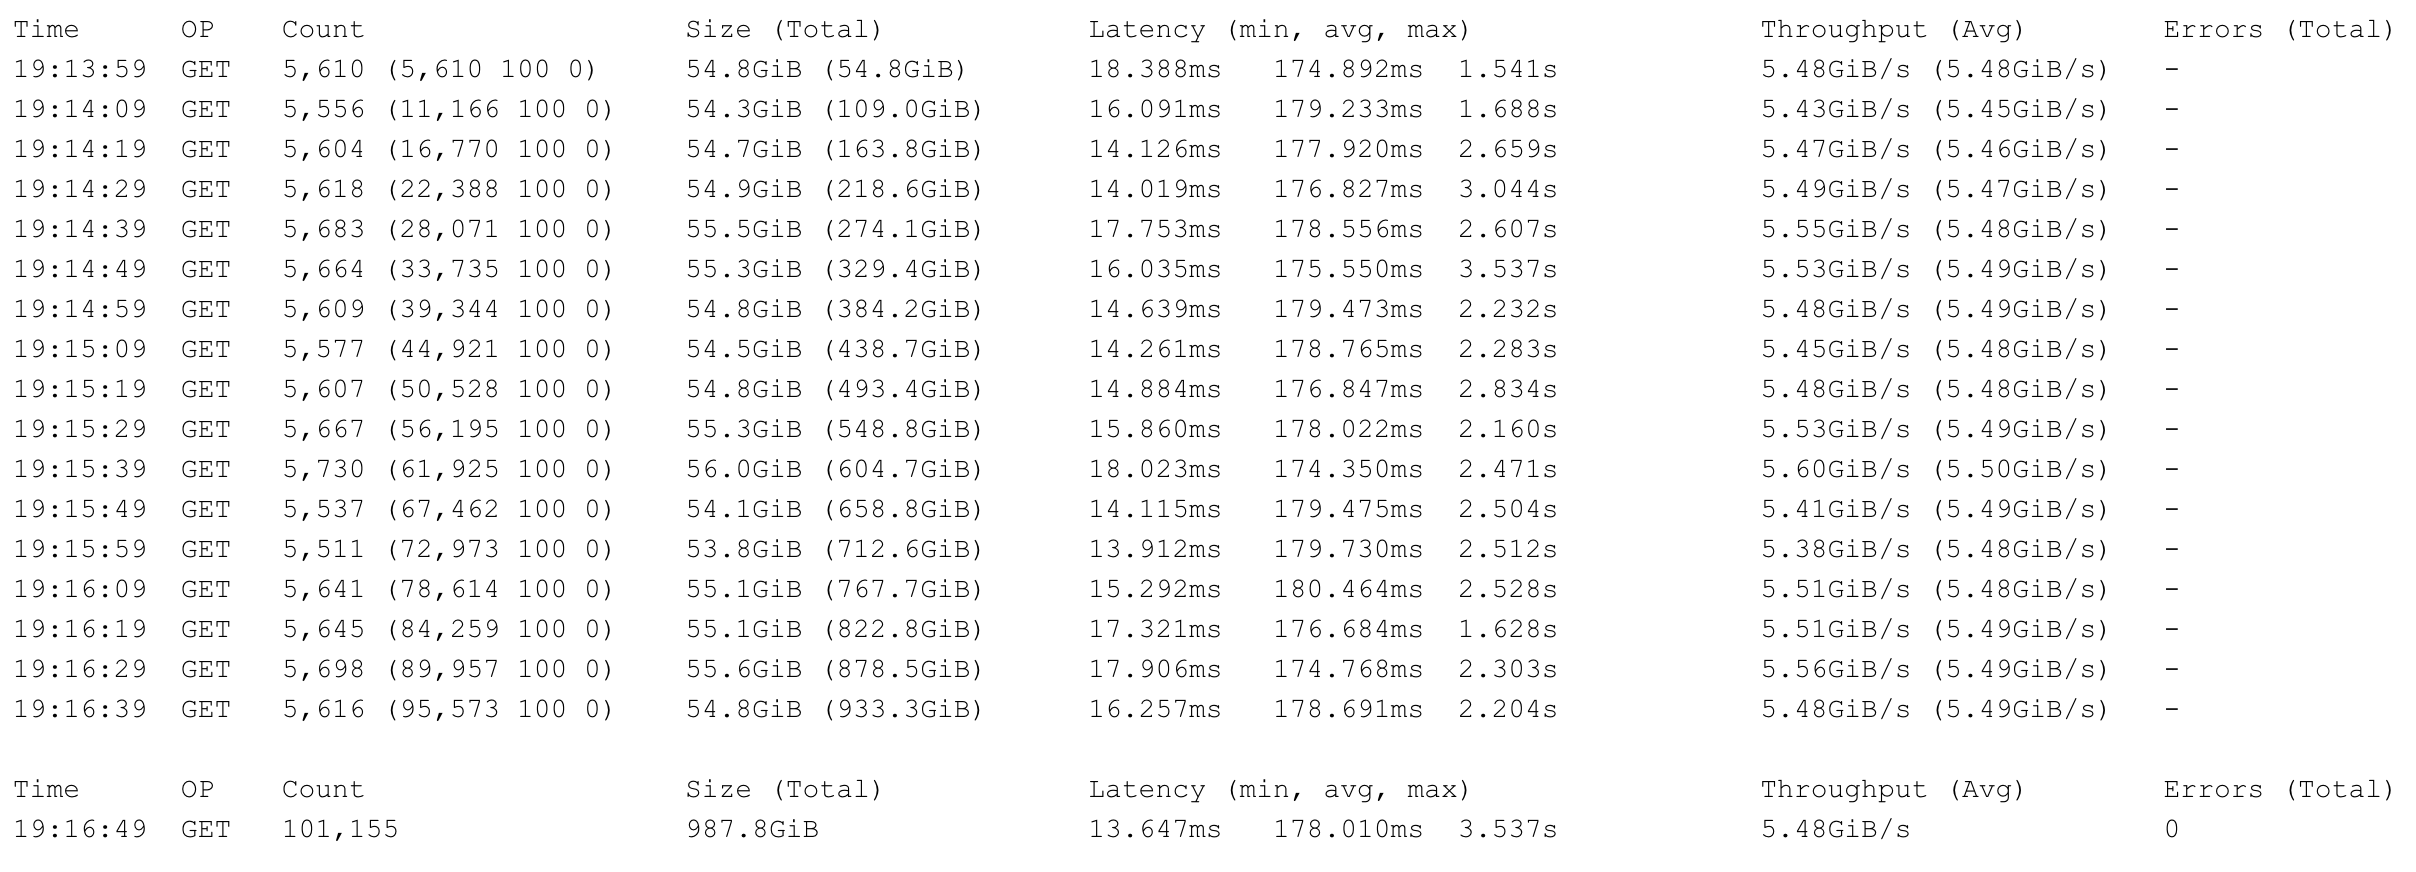
We set up a Grafana dashboard for monitoring and also stored logs from both aisloader and AIS for reference. Below, find the stats logs from one of the ten aisloader clients used in our tests.
Network Efficiency and Recommendations
Our second observation pertains to network efficiency. The relationship between network bandwidth and data payload reveals minimal network overhead when considering MSS (Maximum Segment Size) and MTU (Maximum Transmission Unit).
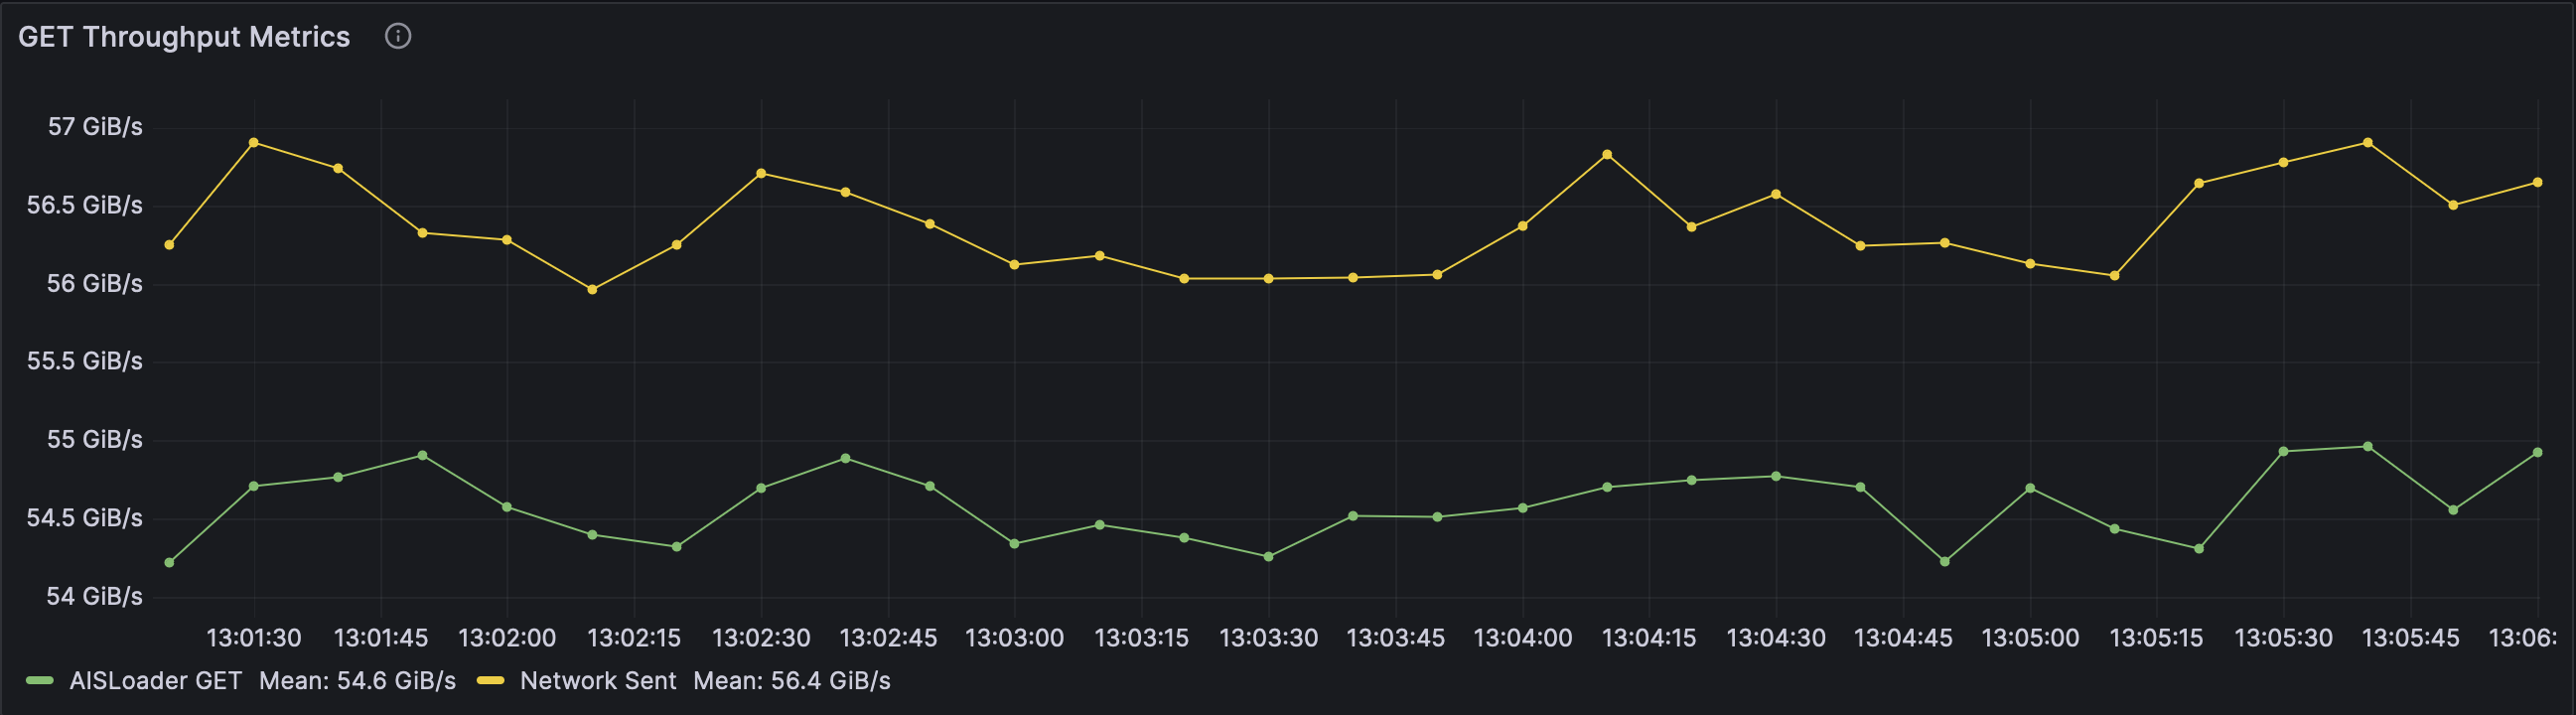
When running a ‘warm GET’ benchmark with 10MiB objects, we observed approximately a 1.8 GiB/s delta between what aisloader received compared to total network traffic when performing a 10 MiB object transfer.
Inspecting the packets revealed 66 bytes of headers:
- 14: fixed-length of the ethernet header
- 20: minimum size of the IP header
- 32: minimum size of the TCP header (20) plus 2 bytes of padding and 10 bytes for the Timestamp option (used for dealing with congestion in busy networks such as this one)
Aisloader reported an object throughput of 54.68 GiB/s, indicating transmission of around 5,600 objects per second (54.68 GiB/10 MiB). To transfer a single object then, we require 1,056 packets with a header overhead of 70KB per object at our current MTU of 9000 ((10MiB + 70KB)/9000). With 70KB of overhead per object and 5,600 objects per second, that makes up roughly 372 MiB of the delta between actual object transfer and total network usage. These findings explain the preference and recommendation for jumbo frames in network configuration. With a larger MTU, e.g. 64K, the 10 MiB object could be sent with only 165 packets, reducing the overhead per object from 70KB to only 10.9 KB.
Looking at the packets again, we can see that each GET request made by aisloader to the cluster was 210 bytes (including HTTP headers). Since each GET request is redirected back to the client and then to the correct target, this also must be included in our measurement for “total network sent.” But, even with 5,600 objects per second, this comes out to only 1.12 MiB/s, almost irrelevant at this scale.
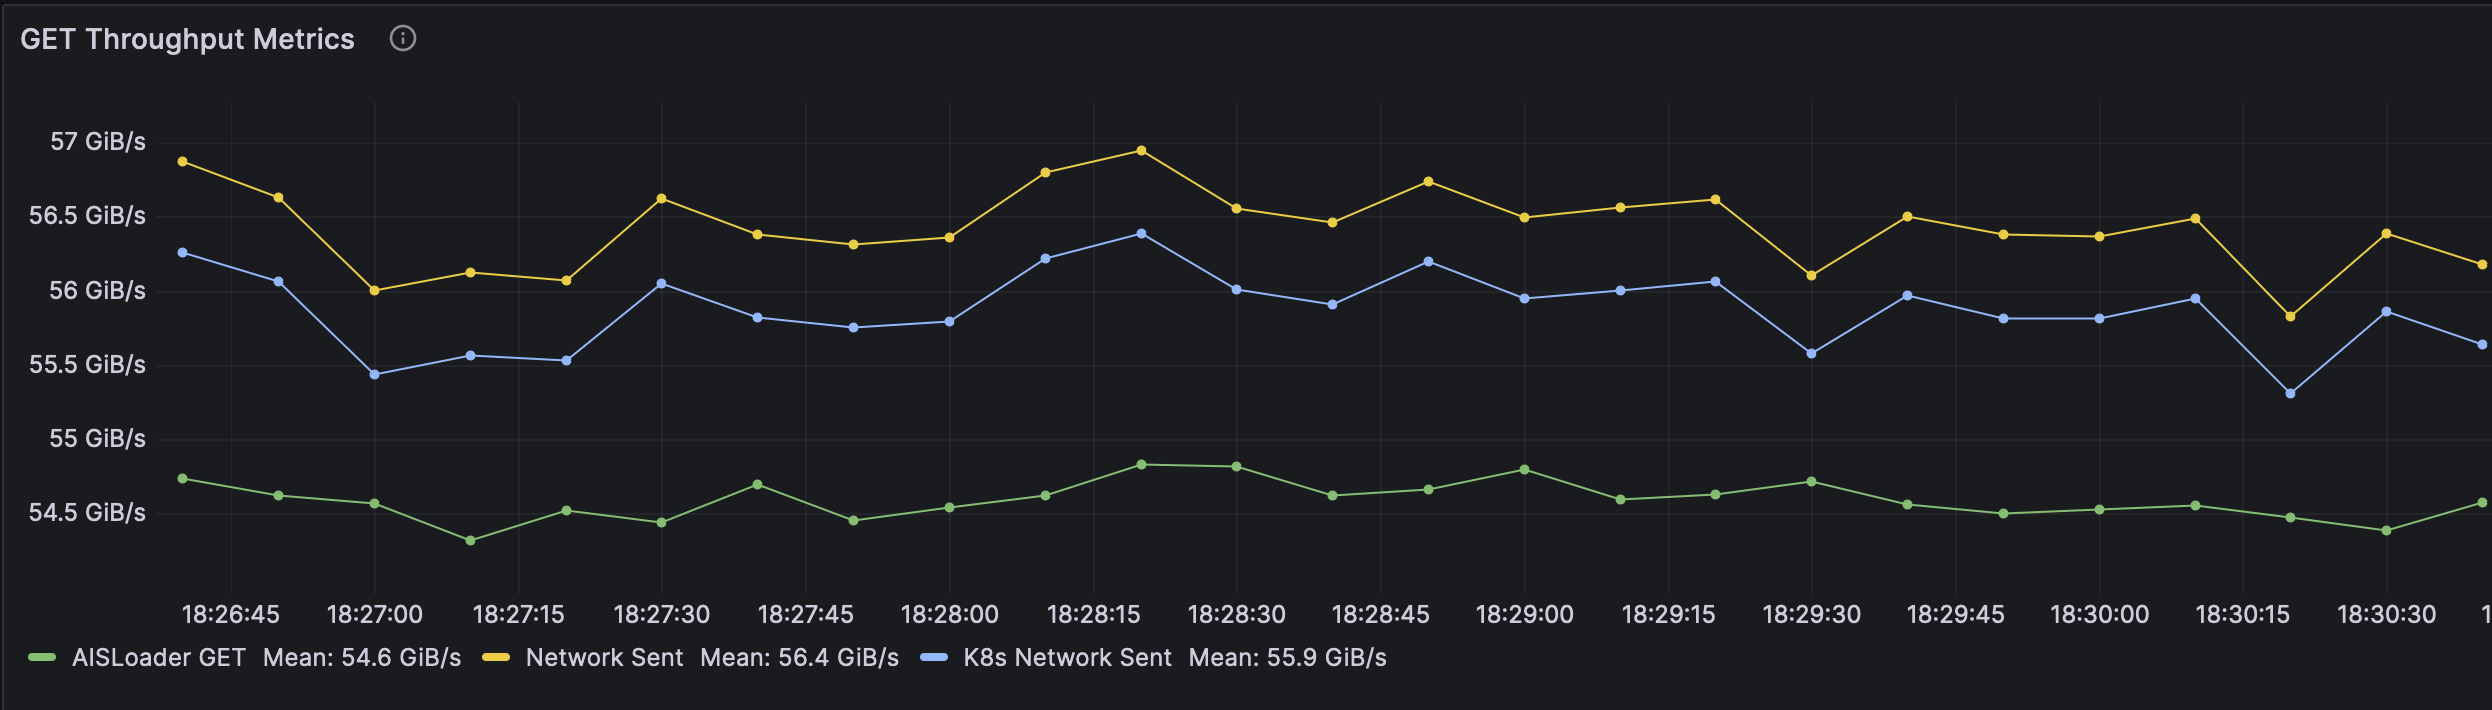
To explain the remaining difference, we added a filter to look only at traffic outbound from the ais cluster in K8s. As seen in the graph below, that reduced the total delta to around 1.3 GiB/s -- cutting out any additional traffic on the hosts, including traffic from metrics. However, that still leaves around 900 MiB/s of extra traffic.
At this point, we began experimenting with the number of aisloader worker threads and realized that 100 workers per client on 10 aisloader clients (1000 worker threads total) was excessive. Not only that, it brought the unintended side effect of increased network congestion.
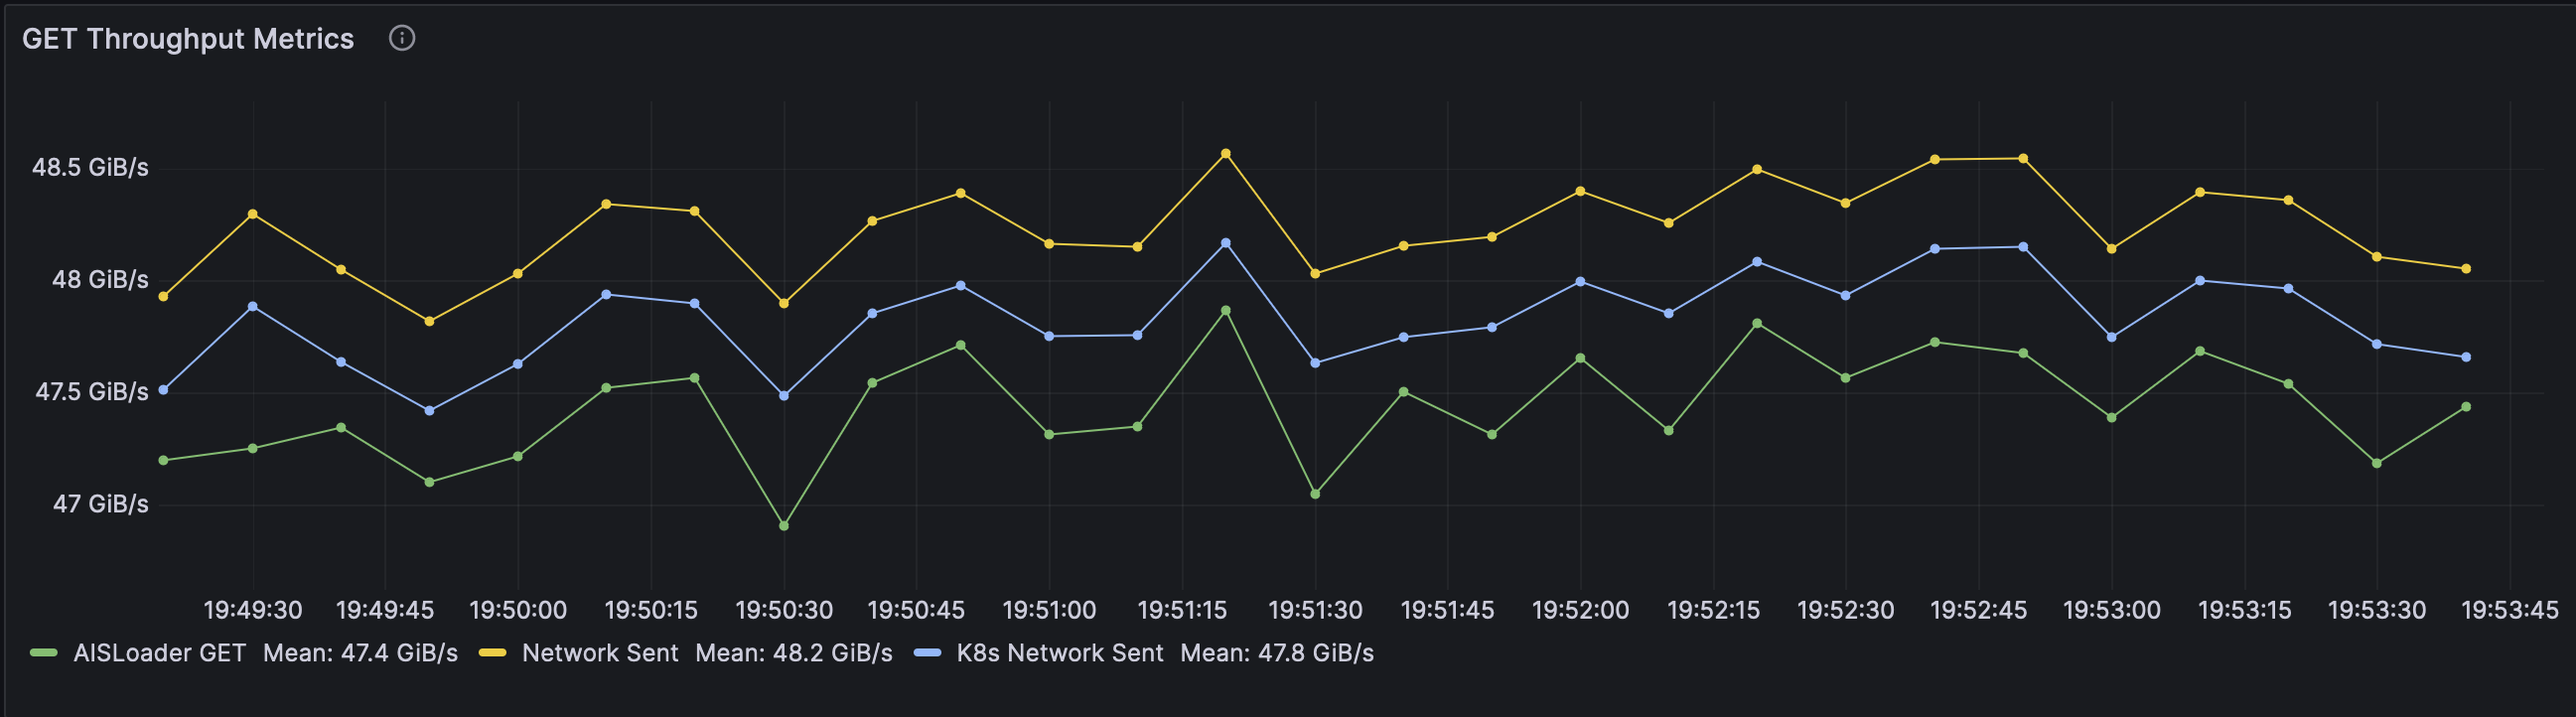
Reducing the number of worker threads to 20 per client resulted in slightly lower object throughput but yielded more stable results, less network overhead, and significantly lower latency. As we increased workers to push the maximum throughput, we began to hit the limits of our network interface, resulting in dropped, retransmitted, out-of-order, and duplicated packets. Without all of this extra congestion, the 20-worker client benchmark showed the results we expected, with an extremely efficient total network overhead of <400 MiB/s.
Finally, each node in our setup was equipped with a 50 Gbps Ethernet Network Adapter. Translated into GiB/s, this provides a maximum transfer speed of approximately 5.82 GiB/s per node. For the 3-node cluster, we recorded an object throughput of 16.5 GiB/s, aligning closely with the theoretical maximum of 17.46 GiB/s.
Similarly, the 10-node cluster exhibited a throughput of around 54.68 GiB/s, nearing the collective capacity of approximately 58.2 GiB/s. Accounting for network overhead, our results show that for this cluster AIS fully saturates our network capacity.
Discussion and Next Steps
As observed in the networking section above, the network interface in our benchmark configuration is the primary bottleneck for performance. To further increase throughput, more nodes and/or higher-performance network adapters will be required. Alternatively, we could also use LACP trunking or (static) NIC teaming.
Either way, our next immediate objective will be - removing network bottleneck.
We also observed significantly better latency numbers when reducing the number of client worker threads from 100 to 20 per client (~41ms vs ~178ms on average).
In a production environment, we would expect the number of AIS nodes to be tuned up or down to meet the client’s needs (and not the other way around). But, for the benchmarks, we tuned the load generated by the client to be appropriate for the AIS cluster.
This raises the question of how many worker threads should be necessary to stress-test this particular cluster.
In our tests, we observed throughput around 4.5 GiB/s with a single worker thread on each aisloader client machine with latencies in the range of 21 ms.
As we increased the number of worker threads, throughput increased almost linearly but latency stayed fairly consistent.
Going up to 10 threads per aisloader client resulted in a throughput increase to around 40 GiB/s with only a ~4 ms increase in latency.
However, as workers increased further we saw diminishing returns.
Moving from 10 to 20 workers per client (100 to 200 total) increased throughput by 20% but increased latency by almost 100%.
Further, changing from 200 to 1000 total workers, the bandwidth increased by only 4% while latency increased by 334%. As the requests began to queue at the network and disk layers, we saw latency spike up drastically with only a slight increase in throughput -- the targets are never idle, but each request must wait (more for) its turn. This spike in latency signals that additional bench workers will start to have adverse effects on the performance.
In other words:
If AIS cluster is not overprovisioned for a given (bench or compute) client and when the load is increasing we may see the picture described above: increasing average latency and “diminishing returns” in terms of getting higher throughput. Our future steps include determining appropriate thresholds for these metrics on a per-workload basis, as they will be crucial not only for generating load for benchmark clusters but also for scaling and sizing the cluster itself in production.
Running the full suite of benchmarks with more finely tuned client workers should result in more optimal latency numbers, perhaps at a small cost to total throughput.
Conclusion
In summary, AIS demonstrated linear scalability in a particular setup, effectively transitioning from 24 to 80 drives. It showed efficient network usage with minimal overhead and saturated our available network capacity. We also observed the tradeoff between maximal throughput and latency and identified signs of excessive load on the cluster. While these findings are specific to our benchmark and setup, they underscore AIStore’s architectural strengths in providing an efficient approach for handling large-scale data in machine learning applications.
References
- GitHub:
- Documentation, blogs, videos:
- https://aiatscale.org
- https://github.com/NVIDIA/aistore/tree/main/docs
- aisloader