METRICS
August 2024 UPDATE: added complete reference that includes all supported metric names (both internal and visible externally), their respective types, and descriptions:
Introduction
AIStore tracks, logs, and reports a large and growing number of counters, latencies and throughputs including (but not limited to) metrics that reflect cluster recovery and global rebalancing, all extended long-running operations, and, of course, the basic read, write, list transactions and more.
Viewership is equally supported via:
- System logs
- CLI and, in particular,
ais show performancecommand - Prometheus
- Any StatsD compliant backend including Graphite/Grafana
For general information on AIS metrics, see Statistics, Collected Metrics, Visualization.
AIStore includes
aisloader- a powerful tool that we use to simulate a variety of AI workloads. For numerous command-line options and usage examples, please seeaisloaderand How To Benchmark AIStore.
Or, just run
make aisloader; aisloaderand see its detailed online help. Note as well thataisloaderis fully StatsD-enabled and supports detailed protocol-level tracing with runtime on and off switching.
Table of Contents
StatsD and Prometheus
AIStore generates a growing number of detailed performance metrics. Other than AIS logs, the stats can be viewed via:
- StatsD/Grafana visualization or
- Prometheus visualization
StatsD publishes local statistics to a compliant backend service (e.g., Graphite) for easy and powerful stats aggregation and visualization.
AIStore is a fully compliant Prometheus exporter that natively supports Prometheus stats collection. There’s no special configuration - the only thing required to enable the corresponding integration is letting AIStore know whether to publish its stats via StatsD or Prometheus.
The StatsD/Grafana option imposes a certain easy-to-meet requirement on the AIStore deployment. Namely, it requires that StatsD daemon (aka service) is deployed locally with each AIS target and with each AIS proxy.
At startup AIStore daemons, both targets and gateways, try to UDP-ping their respective local StatsD daemons on the UDP port 8125 unless redefined via environment AIS_STATSD_PORT. You can disable StatsD reachability probing by setting another environment variable - AIS_STATSD_PROBE - to false or no.
If StatsD server is not listening on the local 8125, the local AIS target (or proxy) will then run without StatsD, and the corresponding stats won’t be captured and won’t be visualized.
For details on all StatsD-supported backends, please refer to this document.
For Prometheus integration, please refer to this separate document
Conventions
All AIS metric names (or simply, metrics) are logged and reported to the StatsD/Grafana using the following naming pattern:
prefix.bucket.metric_name.metric_value|metric_type, where prefix is one of:
aisproxy.<daemon_id>aistarget.<daemon_id>oraisloader.<hostname>-<id>
and metric_type is ms for time duration, c for a counter, and g for a gauge.
More precisely, AIS metrics are named and grouped as follows:
Proxy metrics: IO counters
All collected/tracked counters are 64-bit cumulative integers that continuously increment with each event that they (respectively) track.
| Name | Comment |
|---|---|
aisproxy.<daemon_id>.get |
number of GET-object requests |
aisproxy.<daemon_id>.put |
number of PUT-object requests |
aisproxy.<daemon_id>.del |
number of DELETE-object requests |
aisproxy.<daemon_id>.lst |
number of LIST-objects requests |
aisproxy.<daemon_id>.ren |
... RENAME ... |
aisproxy.<daemon_id>.pst |
... POST ... |
Proxy metrics: error counters
| Name | Comment |
|---|---|
aisproxy.<daemon_id>.err |
Total number of errors |
aisproxy.<daemon_id>.err.get |
Number of GET-object errors |
aisproxy.<daemon_id>.err.put |
Number of PUT-object errors |
aisproxy.<daemon_id>.err.head |
Number of HEAD-object errors |
aisproxy.<daemon_id>.err.delete |
Number of DELETE-object errors |
aisproxy.<daemon_id>.err.list |
Number of LIST-objects errors |
aisproxy.<daemon_id>.err.range |
... RANGE ... |
aisproxy.<daemon_id>.err.post |
... POST ... |
For the most recently updated list of counters, please refer to the source
Proxy metrics: latencies
All request latencies are reported to StatsD/Grafana in milliseconds.
Note: each
aisnode(proxy and target) periodically logs the same latencies in microseconds with a (configurable) logging interval (default = 10s).
Generally, AIStore logs can be considered a redundant source of information on system performance - the information that can be used either in addition to Graphite/Grafana or when the latter is not deployed or configured.
| Name | Comment |
|---|---|
aisproxy.<daemon_id>.get |
GET-object latency |
aisproxy.<daemon_id>.lst |
LIST-objects latency |
aisproxy.<daemon_id>.kalive |
Keep-Alive (roundtrip) latency |
Target Metrics
AIS target metrics include all of the proxy metrics (see above), plus the following:
| Name | Comment |
|---|---|
aistarget.<daemon_id>.get.cold |
number of cold-GET object requests |
aistarget.<daemon_id>.get.cold.size |
cold GET cumulative size (in bytes) |
aistarget.<daemon_id>.lru.evict |
number of LRU-evicted objects |
aistarget.<daemon_id>.tx |
number of objects sent by the target |
aistarget.<daemon_id>.tx.size |
cumulative size (in bytes) of all transmitted objects |
aistarget.<daemon_id>.rx |
number of objects received by the target |
aistarget.<daemon_id>.rx.size |
cumulative size (in bytes) of all the received objects |
For the most recently updated list of counters, please refer to the source
AIS loader metrics
AIS loader generates metrics for 3 (three) types of requests:
- GET (object) - metric names are prefixed with
aisloader.<ip>.<loader_id>.get. - PUT (object) - metric names start with
aisloader.<ip>.<loader_id>.put. - Read cluster configuration - the prefix includes
aisloader.<ip>.<loader_id>.getconfig.
All latency metrics are in milliseconds, all sizes are always in bytes.
GET object
Note: in the tables below, traced intervals of time are denoted as (from time, to time), respectively.
| Name | Comment |
|---|---|
aisloader.<hostname>-<id>.get.pending.<value> |
number of unfinished GET requests waiting in a queue (updated after every completed request) |
aisloader.<hostname>-<id>.get.count.1 |
total number of requests |
aisloader.<hostname>-<id>.get.error.1 |
total number of failed requests |
aisloader.<hostname>-<id>.get.throughput.<value> |
total size of received objects |
aisloader.<hostname>-<id>.get.latency.<value> |
request latency = (request initialized, data transfer successfully completes) |
aisloader.<hostname>-<id>.get.latency.proxyconn.<value> |
(request started, connected to a proxy) |
aisloader.<hostname>-<id>.get.latency.proxy.<value> |
(connected to proxy, proxy redirected) |
aisloader.<hostname>-<id>.get.latency.targetconn.<value> |
(proxy redirected, connected to target) |
aisloader.<hostname>-<id>.get.latency.target.<value> |
(connected to target, target responded) |
aisloader.<hostname>-<id>.get.latency.posthttp.<value> |
(target responded, data transfer completed) |
aisloader.<hostname>-<id>.get.latency.proxyheader.<value> |
(proxy makes a connection, proxy finishes writing headers to the connection) |
aisloader.<hostname>-<id>.get.latency.proxyrequest.<value> |
(proxy finishes writing headers, proxy completes writing request to the connection) |
aisloader.<hostname>-<id>.get.latency.proxyresponse.<value> |
(proxy finishes writing request to a connection, proxy gets the first bytes of the response) |
aisloader.<hostname>-<id>.get.latency.targetheader.<value> |
(target makes a connection, target finishes writing headers to the connection) |
aisloader.<hostname>-<id>.get.latency.targetrequest.<value> |
(target finishes writing headers, target completes writing request to the connection) |
aisloader.<hostname>-<id>.get.latency.targetresponse.<value> |
(target finishes writing request, proxy gets the first bytes of the response) |
PUT object
Note: in the table, traced intervals of time are denoted as (from time, to time):
| Name | Comment |
|---|---|
aisloader.<hostname>-<id>.put.pending.<value> |
number of unfinished PUT requests waiting in a queue (updated after every completed request) |
aisloader.<hostname>-<id>.put.count.1 |
total number of requests |
aisloader.<hostname>-<id>.put.error.1 |
total number of failed requests |
aisloader.<hostname>-<id>.put.throughput.<value> |
total size of objects PUT into a bucket |
aisloader.<hostname>-<id>.put.latency.<value> |
request latency = (request initialized, data transfer successfully complete) |
aisloader.<hostname>-<id>.put.latency.proxyconn.<value> |
(request started, connected to proxy) |
aisloader.<hostname>-<id>.put.latency.proxy.<value> |
(connected to proxy, proxy redirected) |
aisloader.<hostname>-<id>.put.latency.targetconn.<value> |
(proxy redirected, connected to target) |
aisloader.<hostname>-<id>.put.latency.target.<value> |
(connected to target, target responded) |
aisloader.<hostname>-<id>.put.latency.posthttp.<value> |
(target responded, data transfer completed) |
aisloader.<hostname>-<id>.put.latency.proxyheader.<value> |
(proxy makes a connection, proxy finishes writing headers) |
aisloader.<hostname>-<id>.put.latency.proxyrequest.<value> |
(proxy finishes writing headers, proxy completes writing request) |
aisloader.<hostname>-<id>.put.latency.proxyresponse.<value> |
(proxy finishes writing request, proxy gets the first bytes of the response) |
aisloader.<hostname>-<id>.put.latency.targetheader.<value> |
(target makes a connection, target finishes writing headers) |
aisloader.<hostname>-<id>.put.latency.targetrequest.<value> |
(target finishes writing headers, target completes writing request) |
aisloader.<hostname>-<id>.put.latency.targetresponse.<value> |
(target finishes writing request, proxy gets the first bytes of the response) |
Read cluster configuration
Note: traced intervals of time are denoted as (from time, to time):
| Name | Comment |
|---|---|
aisloader.<hostname>-<id>.getconfig.count.1 |
total number of requests to read cluster settings |
aisloader.<hostname>-<id>.getconfig.latency.<value> |
request latency = (read configuration request started, configuration received) |
aisloader.<hostname>-<id>.getconfig.latency.proxyconn.<value> |
(read configuration request started, connection to a proxy is made) |
aisloader.<hostname>-<id>.getconfig.latency.proxy.<value> |
(connection to a proxy is made, proxy redirected the request) |
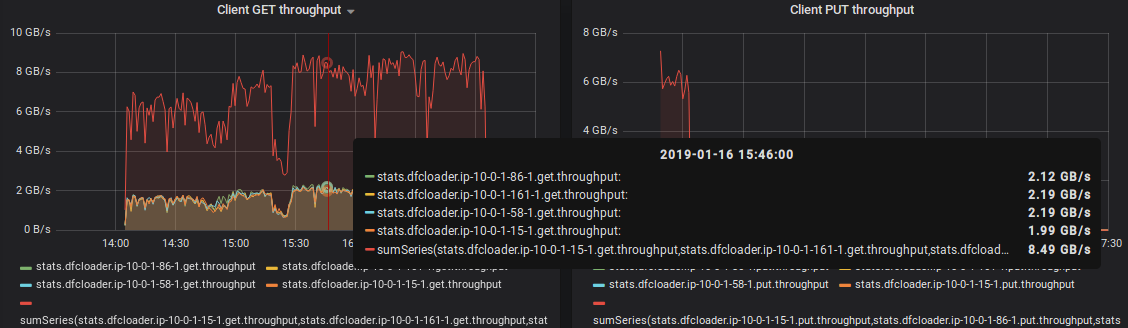
A somewhat outdated example of how these metrics show up in the Grafana dashboard follows:
Debug-Mode Observability
For development and, more generally, for any non-production deployments AIS supports building with debug, for instance:
$ MODE=debug make deploy
As usual, debug builds incorporate more runtime checks and extra logging. But in addition AIS debug build provides a special API endpoint at hostname:port/debug/vars that can be accessed (via browser or Curl) at any time to display the current values of:
- all stats counters (including error counters)
- all latencies including keepalive
- mountpath capacities
- mountpath (disk) utilizations
- total number of goroutines
- memory stats
and more.
Notation
hostname:portstands for TCP endpoint of any deployed AIS node, gateway or storage target.
Example output:
$ curl hostname:port/debug/vars
{
"ais.ios": {"/ais/mp1:util%": 20, "/ais/mp2:util%": 23, "/ais/mp3:util%": 22, "/ais/mp4:util%": 25},
"ais.stats": {"kalive.ns": 735065, "lst.n": 45, "lst.ns": 2892015, "num-goroutines": 27, "put.n": 1762, "put.ns": 1141380, "put.redir.ns": 16596465, "up.ns.time": 30012389406},
"cmdline": ["/bin/aisnode","-config=.ais/ais.json","-local_config=.ais/ais_local.json","-role=target"],
"memstats": {"Alloc":43209256,"TotalAlloc":57770120,"Sys":75056128,"Lookups":0,"Mallocs":215893,"Frees":103090,"HeapAlloc":43209256, ...}
...
}