Maximizing Cluster Bandwidth with AIS Multihoming
Identifying bottlenecks in high-performance systems is critical to optimize the hardware and associated costs. While AIStore (AIS) can provide linear scaling of performance with additional drives, in our previous article we observed a hard limit to this scaling -- our total network bandwidth. In our benchmark cluster, each AIS target node was provisioned with 8 NVMe drives. These drives provided a significantly higher data throughput than the node’s single 50 Gbps network interface could handle.
We needed to expand our network capacity to increase our available read throughput and make the most of these powerful drives. One solution, called network bonding, network teaming, or link aggregation, allows for multiple network interfaces to combine their throughput over a single IP address. However, this is not always a supported mechanism especially in cloud environments where users may not have full control over the network. This was the case for our benchmark cluster, deployed on Oracle Cloud Infrastructure (OCI). The shape we used allowed us to attach additional virtual interfaces (VNICs) to the 2 physical interfaces on the host, but did not support bonding both of these interfaces to a single IP address, so we needed a different solution.
An alternative, introduced in the upcoming AIS release 3.22, is multihoming. This feature works on any multi-interface hosts with no extra configuration of link aggregation. Rather than combining the interfaces onto a single external IP for each node, this approach communicates over them independently, allowing for full utilization of all interfaces. In our benchmarks below, we used multihoming to achieve nearly double the throughput results from our previous tests and unlocked the full potential of our high-speed NVMe drives when reading.
Configuring the hosts
The test setup used for benchmarking our AIS cluster with multihoming is shown below:
- AIS Hosts: 10 nodes running Oracle Linux 8 on the following OCI shape:
| Shape | OCPU | Memory (GB) | Local Disk | Max Network Bandwidth |
|---|---|---|---|---|
| BM.DenseIO.E4.128 | 128 | 2048 | 54.4 TB NVMe SSD Storage (8 drives) | 2x 50 Gbps |
- AISLoader clients: 10 nodes running Ubuntu 22.04 on the following OCI shape:
| Shape | OCPU | Memory (GB) | Local Disk | Max Network Bandwidth |
|---|---|---|---|---|
| BM.Standard3.64 | 64 | 1024 | Block storage only | 2 x 50 Gbps |
- Networking: AIS hosts and AISLoader clients were deployed in a single OCI VCN with 2 subnets to support a secondary VNIC on all client and AIS hosts
Deploying with Multihoming
For a full walkthrough of a multi-homed AIS deployment, check the documentation in the AIS K8s repository.
Before taking advantage of AIS multihoming, the systems themselves must be configured with multiple IPs on multiple interfaces. In our case, this involved adding a second VNIC in OCI and configuring the OS routing rules using their provided scripts, following this OCI guide.
IMPORTANT: To use multihoming you must use an AIS K8s Operator version >= v0.97 and deploy AIS version >= 3.22 (or ‘latest’)`
Next, update the ansible host config to tell the deployment which additional IPs to use. Add additional_hosts to each ansible host entry as a comma-separated list of any additional IPs you want to use. For example, the hosts file for our 3 node cluster might look like this:
[ais]
controller_host ansible_host=10.51.248.1 additional_hosts=10.51.248.32
worker1 ansible_host=10.51.248.2 additional_hosts=10.51.248.33
worker2 ansible_host=10.51.248.3 additional_hosts=10.51.248.34
By default, K8s pods do not allow multiple IPs. To add this, we’ll need to use Multus CNI. The create_network_definition playbook (provided in the ais-k8s repo) will automatically install the latest version of Multus in the cluster and create a network definition the pods can use.
Once the additional hosts have been added to the hosts file and the network attachment definition has been created, all that is needed is a standard AIS deployment. The AIS K8s operator will take care of connecting each AIS pod to the specified additional hosts through Multus.
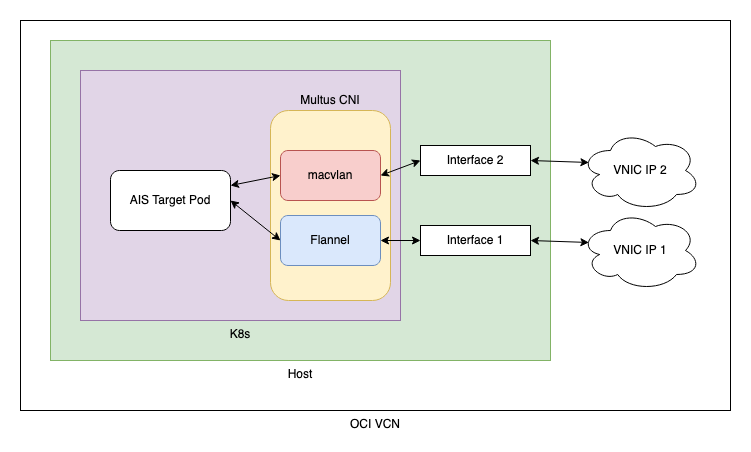
Below is a simple network diagram of how the AIS pods work with Multus in our cluster. We are using a macvlan bridge to connect the pod to the second interface. This is configured in the network attachment definition created by our create_network_definition playbook. AIS can also be configured to use other Multus network attachment definitions. See our multihome deployment doc and the Multus usage guide for details on using this playbook and configuring network attachment definitions.
After deploying with multihoming, we configured our AIS test buckets with a PBSS backend (NVIDIA’s SwiftStack implementation). This is an s3 compatible backend, so AIS can handle any s3 requests to PBSS without API changes. When a GET request fetches a new object, AIS will store that object locally in the cluster for future use.
Benchmark results
We ran 3 benchmarks to validate the performance gains of using AIS as a fast-tier with multihoming. In these tests, “cold” GET refers to a GET request to AIS where the object does not exist locally in the AIS cluster and must be fetched from the remote backend. On the other hand, a “warm” GET is our terminology for a request where the AIS cluster has a local copy of the data and can simply return it directly to the client.
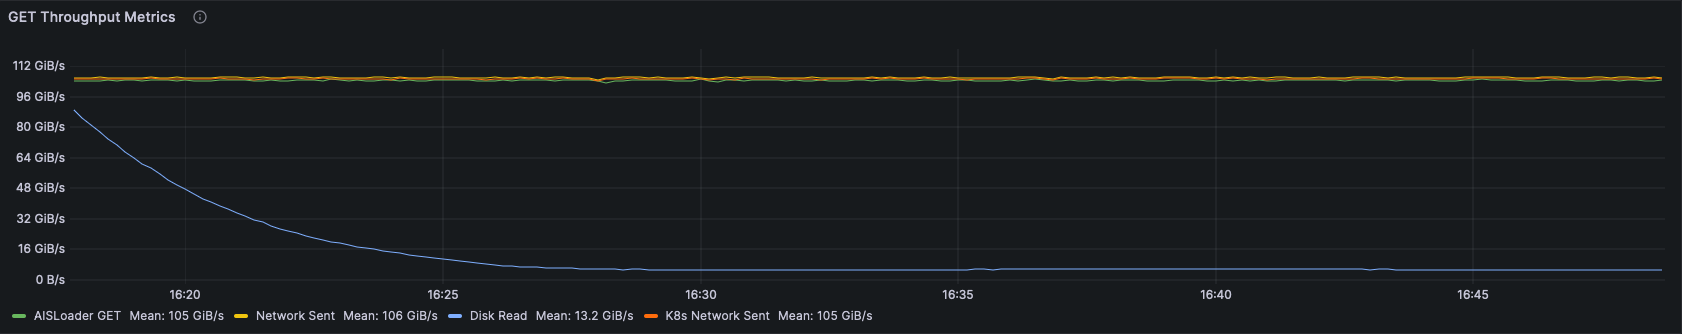
Test 1: Cold GET with PBSS backend
For the first benchmark, we ran a single epoch of GET requests against a remote 20 TiB PBSS bucket populated with 10MiB objects. Each AISLoader client reads every object in the dataset in random order. Over time, as objects are cached in AIS, the next clients to fetch the same object are able to get it without reaching out to PBSS.
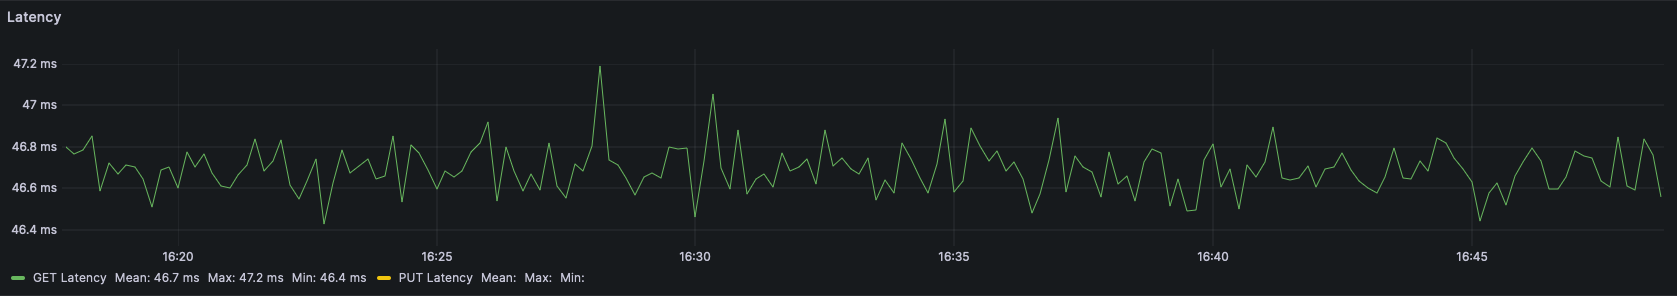
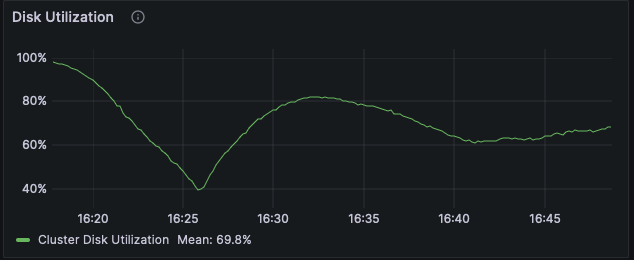
Test 2: Warm GET
Next we ran a single epoch against the same bucket once all the objects are stored locally in AIS. Querying the data already cached in AIS showed a massive improvement over fetching the data remotely from PBSS. We saw consistently high throughput and low latency, but because nearly the entire dataset could fit in the memory on the AIS nodes, disk usage was inconsistent.
Note these numbers depend heavily on specific deployment and network bandwidth to PBSS.
AIS has an intentional advantage here for its use as a fast-tier.
It is both nearer to the client (same VCN) and uses higher performance drives than the remote PBSS cluster.
| Metric | Direct from PBSS | From AIS Warm GET |
|---|---|---|
| Average Throughput | 3.12 GiB/s | 104.64 GiB/s |
| Average Latency | 1570 ms | 46.7 ms |
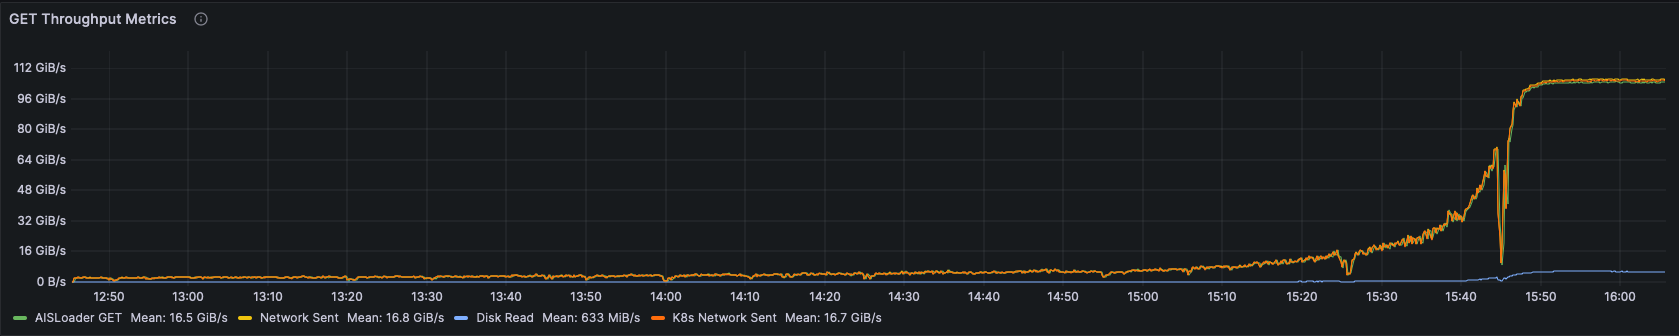
Test 3: Warm GET, 100 TiB local dataset
Finally, we populated a separate 100 TiB bucket of 10 MiB objects to ensure that each query would actually have to do a fresh read from the disk. This would test the disk performance scaling. We also ran FIO tests against the drives themselves to make sure the performance scaled linearly.
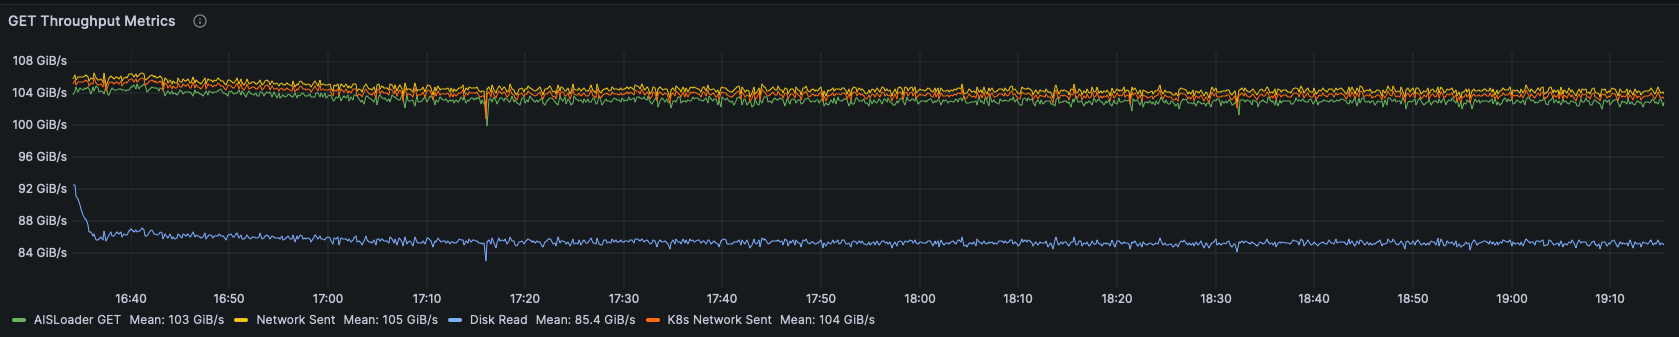
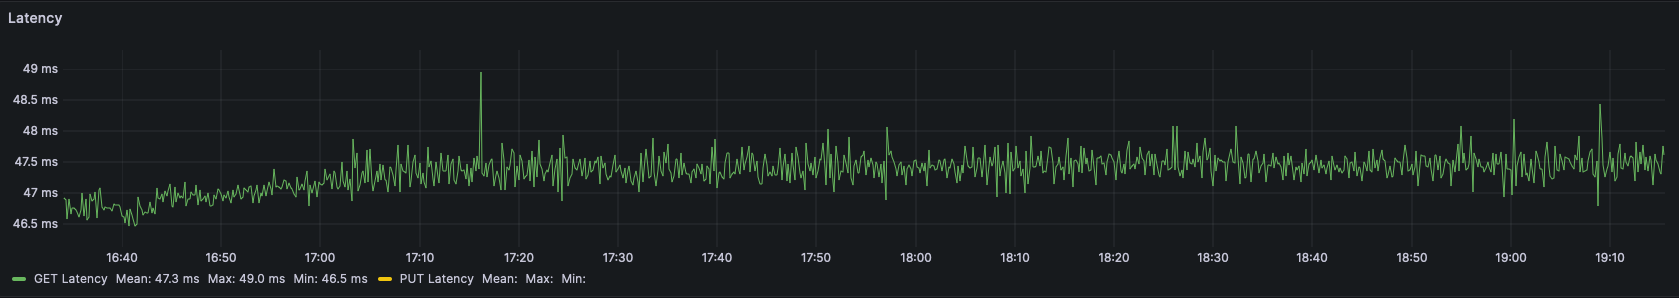
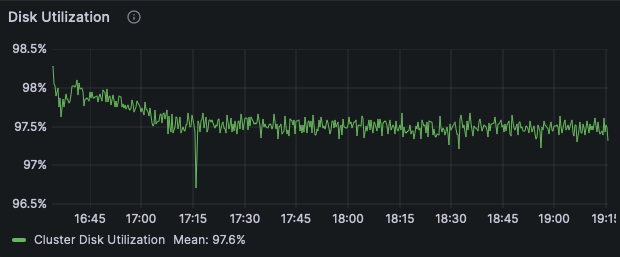
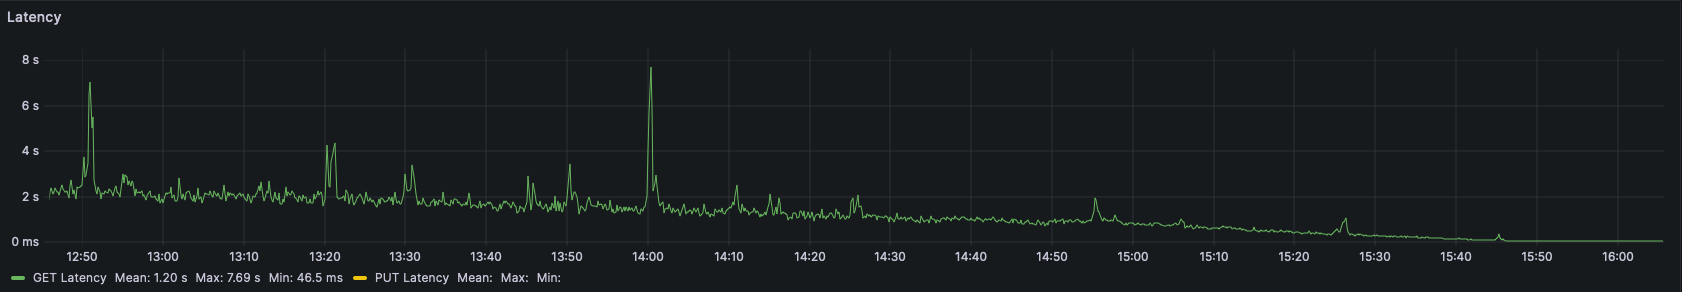
Total average latency: 47.29 ms
Total throughput: 103.247 GiB/s
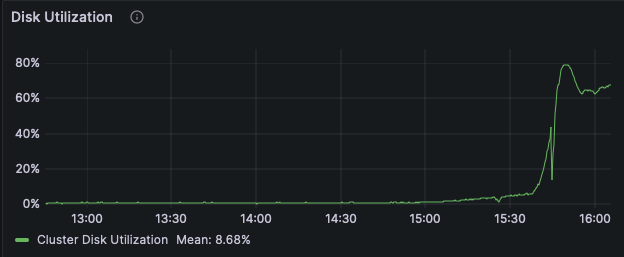
The throughput and latency numbers do not show much difference from the benchmark on the smaller dataset, but the disk utilization is much higher, consistently over 97%. This indicates we have shifted the limiting factor of our cluster performance to the disks!
While this is the desired result under a stress load, keep in mind this is not what you would want to see from your cluster for sustained use in production. To keep these disks busy, there is a queue of disk operations that will result in an increase in latency if it grows too large. We observed this in a separate test with even more clients. With 80 worker threads per client rather than 50, we saw an increase in latency from 47ms to 72ms along with lower per-client throughput. A pattern of increased latency and increased disk queueing indicates a need for scaling up the AIS cluster.
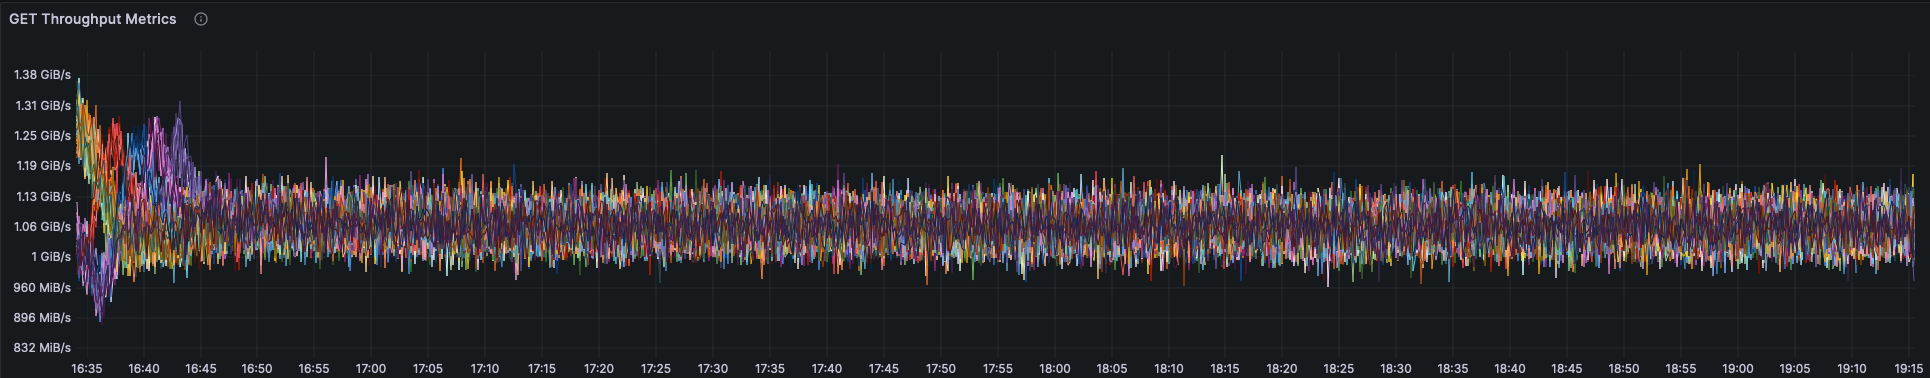
This chart shows the individual disk throughput for all disks in the cluster. There is only a small variance as each drive is kept busy and performing near its max specification.
FIO Comparison:
To check that this is consistent with the expected performance from our drives, we ran a FIO benchmark against the drives on one of our machines to get an idea of their capabilities.
We ran the FIO benchmark with the following configuration:
[global]
ioengine=libaio
direct=0
verify=0
time_based
runtime=30s
refill_buffers
group_reporting
size=10MiB
iodepth=32

[read-job]
rw=read
bs=4096
numjobs=1
We noticed some variation from run to run with FIO, but the total throughput for a direct read from all disks on the node we tested was around 10.99 GiB/s. The average throughput for each node in the cluster was 10.32 GiB/s. So compared to this small disk test, AIS achieved 94% of the total read capacity of the drives on this setup.
Conclusion
By utilizing an additional network interface and thus removing the network bottleneck, we were able to achieve full drive scaling and maximize the use of drives in our cluster with our specific workload. In our “cold GET” benchmark, we observed an uptick in throughput and latency numbers as objects are stored in AIS. With all the data stored in AIS, our “warm GET” benchmark showed high performance across the entire epoch, limited now by disks rather than network. Moving to an even larger dataset, the cluster showed high disk utilization and disk read performance consistent with results from independent drive benchmarks. Even with a very large dataset under heavy load, the cluster maintained low latency and consistently high throughput to all clients.