PROMETHEUS
August 2024 UPDATES:
- added complete reference that includes all supported metric names (both internal and visible externally), their respective types, and descriptions:
- building
aisnodewith StatsD requires the corresponding build tag; build-wise, Prometheus is, effectively, the default. -
for details, see related: package
stats - Reference: all supported metrics
Monitoring AIStore with Prometheus
AIStore tracks a growing list of performance counters, utilization percentages, latency and throughput metrics, transmitted and received stats (total bytes and numbers of objects), error counters and more.
Viewership is equally supported via:
- AIS node logs
- CLI, and specifically
ais show cluster statscommand
On the monitoring backend side, AIS equally supports:
- StatsD with any compliant backend (e.g., Graphite/Grafana), and
- Prometheus
This document mostly talks about the “Prometheus” option. Other related documentation includes AIS metrics readme that provides general background, naming conventions and examples, and also have a separate section on aisloader metrics - the metrics generated by aisloader when running its benches.
For
aisloader, please refer to Load Generator and How To Benchmark AIStore.
Prometheus Exporter
AIStore is a fully compliant Prometheus exporter that natively supports Prometheus stats collection. There’s no special configuration - the only thing required to enable the corresponding integration is letting AIStore know whether to publish its stats via StatsD or Prometheus.
The corresponding binary choice between StatsD and Prometheus is a build-time switch that is a single build tag: statsd.
As a side note, the entire assortment of supported build tags is demonstrated by the following
aisnode-building examples:
# 1) no build tags, no debug
MODE="" make node
# 2) no build tags, debug
MODE="debug" make node
# 3) cloud backends, no debug
AIS_BACKEND_PROVIDERS="aws azure gcp" MODE="" make node
# 4) cloud backends, debug, statsd
## Note: if `statsd` build tag is not specified `aisnode` will get built with Prometheus support.
## For additional information (including the binary choice between StatsD and Prometheus), please see docs/metrics.md
TAGS="aws azure gcp statsd debug" make node
# 5) statsd, debug, nethttp (note that fasthttp is used by default)
TAGS="nethttp statsd debug" make node
When a starting-up AIS node (gateway or storage target) is built with Prometheus support (ie., without build tag statsd) it will:
- register all its metric descriptions (names, labels, and helps) with Prometheus, and
- provide HTTP endpoint
/metricsfor subsequent collection (aka “scraping”) by Prometheus.
Here’s a few
Simplified Examples
$ aisnode -config=/etc/ais/ais.json -local_config=/etc/ais/ais_local.json -role=target

# Assuming the target with hostname "hostname" listens on port 8081:
$ curl http://hostname:8081/metrics | grep ais

# A sample output follows below (note the metric names that must be self-explanatory):

```console
   # HELP ais_target_disk_avg_rsize average read size (bytes)
   # TYPE ais_target_disk_avg_rsize gauge
   ais_target_disk_avg_rsize{disk="nvme0n1",node_id="ClCt8081"} 4096
   # HELP ais_target_disk_avg_wsize average write size (bytes)
   # TYPE ais_target_disk_avg_wsize gauge
   ais_target_disk_avg_wsize{disk="nvme0n1",node_id="ClCt8081"} 260130
   # HELP ais_target_disk_read_mbps read bandwidth (MB/s)
   # TYPE ais_target_disk_read_mbps gauge
   ais_target_disk_read_mbps{disk="nvme0n1",node_id="ClCt8081"} 14336
   # HELP ais_target_disk_util disk utilization (%%)
   # TYPE ais_target_disk_util gauge
   ais_target_disk_util{disk="nvme0n1",node_id="ClCt8081"} 15
   # HELP ais_target_disk_write_mbps write bandwidth (MB/s)
   # TYPE ais_target_disk_write_mbps gauge
   ais_target_disk_write_mbps{disk="nvme0n1",node_id="ClCt8081"} 4.54291456e+08
   # HELP ais_target_kalive_ms in-cluster keep-alive (heartbeat): average time (milliseconds) over the last periodic.stats_time interval
   # TYPE ais_target_kalive_ms gauge
   ais_target_kalive_ms{node_id="ClCt8081"} 0
   # HELP ais_target_put_bytes PUT: total cumulative size (bytes)
   # TYPE ais_target_put_bytes counter
   ais_target_put_bytes{node_id="ClCt8081"} 1.078984704e+10
   # HELP ais_target_put_count total number of executed PUT(object) requests
   # TYPE ais_target_put_count counter
   ais_target_put_count{node_id="ClCt8081"} 1029
   # HELP ais_target_put_mbps PUT: average throughput (MB/s) over the last periodic.stats_time interval
   # TYPE ais_target_put_mbps gauge
   ais_target_put_mbps{node_id="ClCt8081"} 412.09
   # HELP ais_target_put_ms PUT: average time (milliseconds) over the last periodic.stats_time interval
   # TYPE ais_target_put_ms gauge
...
...
   # HELP ais_target_get_mbps GET: average throughput (MB/s) over the last periodic.stats_time interval
   # TYPE ais_target_get_mbps gauge
   ais_target_get_mbps{node_id="ClCt8081"} 7189.04
   # HELP ais_target_get_ms GET: average time (milliseconds) over the last periodic.stats_time interval
   # TYPE ais_target_get_ms gauge
   ais_target_get_ms{node_id="ClCt8081"} 7
   # HELP ais_target_get_ns_total GET: total cumulative time (nanoseconds)
   # TYPE ais_target_get_ns_total counter
   ais_target_get_ns_total{node_id="ClCt8081"} 5.0083047525e+10
   # HELP ais_target_get_redir_ms GET: average gateway-to-target HTTP redirect latency (milliseconds) over the last periodic.stats_time interval
   # TYPE ais_target_get_redir_ms gauge
   ais_target_get_redir_ms{node_id="ClCt8081"} 0
   # HELP ais_target_lcache_collision_count number of LOM cache collisions (core, internal)
   # TYPE ais_target_lcache_collision_count counter
   ais_target_lcache_collision_count{node_id="ClCt8081"} 8511
   # HELP ais_target_lst_count total number of executed list-objects requests
   # TYPE ais_target_lst_count counter
   ais_target_lst_count{node_id="ClCt8081"} 1
   # HELP ais_target_lst_ms list-objects: average time (milliseconds) over the last periodic.stats_time interval
   # TYPE ais_target_lst_ms gauge
   ais_target_lst_ms{node_id="ClCt8081"} 4
   # HELP ais_target_put_bytes PUT: total cumulative size (bytes)
   # TYPE ais_target_put_bytes counter
   ais_target_put_bytes{node_id="ClCt8081"} 1.721761792e+10
   # HELP ais_target_put_count total number of executed PUT(object) requests
   # TYPE ais_target_put_count counter
   ais_target_put_count{node_id="ClCt8081"} 1642
   # HELP ais_target_put_ns_total PUT: total cumulative time (nanoseconds)
   # TYPE ais_target_put_ns_total counter
   ais_target_put_ns_total{node_id="ClCt8081"} 9.44367232e+09
   # HELP ais_target_state_flags bitwise 64-bit value that carries enumerated node-state flags, including warnings and alerts; see https://github.com/NVIDIA/aistore/blob/main/cmn/cos/node_state.go for details
   # TYPE ais_target_state_flags gauge
   ais_target_state_flags{node_id="ClCt8081"} 6
   # HELP ais_target_uptime this node's uptime since its startup (seconds)
   # TYPE ais_target_uptime gauge
   ais_target_uptime{node_id="ClCt8081"} 210
...
...
And for continuous monitoring of any given subset of metrics (still without using actual Prometheus installation) one could also run something like:
for i in {1..99999}; do curl http://hostname:8081/metrics --silent | grep "ais_target_get_n.*node"; sleep 1; done
References:
- https://prometheus.io/docs/instrumenting/writing_exporters/
- https://prometheus.io/docs/concepts/data_model/
- https://prometheus.io/docs/concepts/metric_types/
StatsD Exporter for Prometheus
If, for whatever reason, you decide to use the “StatsD” option, you can still send AIS stats to Prometheus - via its own generic statsd_exporter extension that on-the-fly translates StatsD formatted metrics.
Note: while native Prometheus integration (the previous section) is the preferred and recommended option statsd_exporter can be considered a backup plan for deployments with very special requirements.
First, the picture:
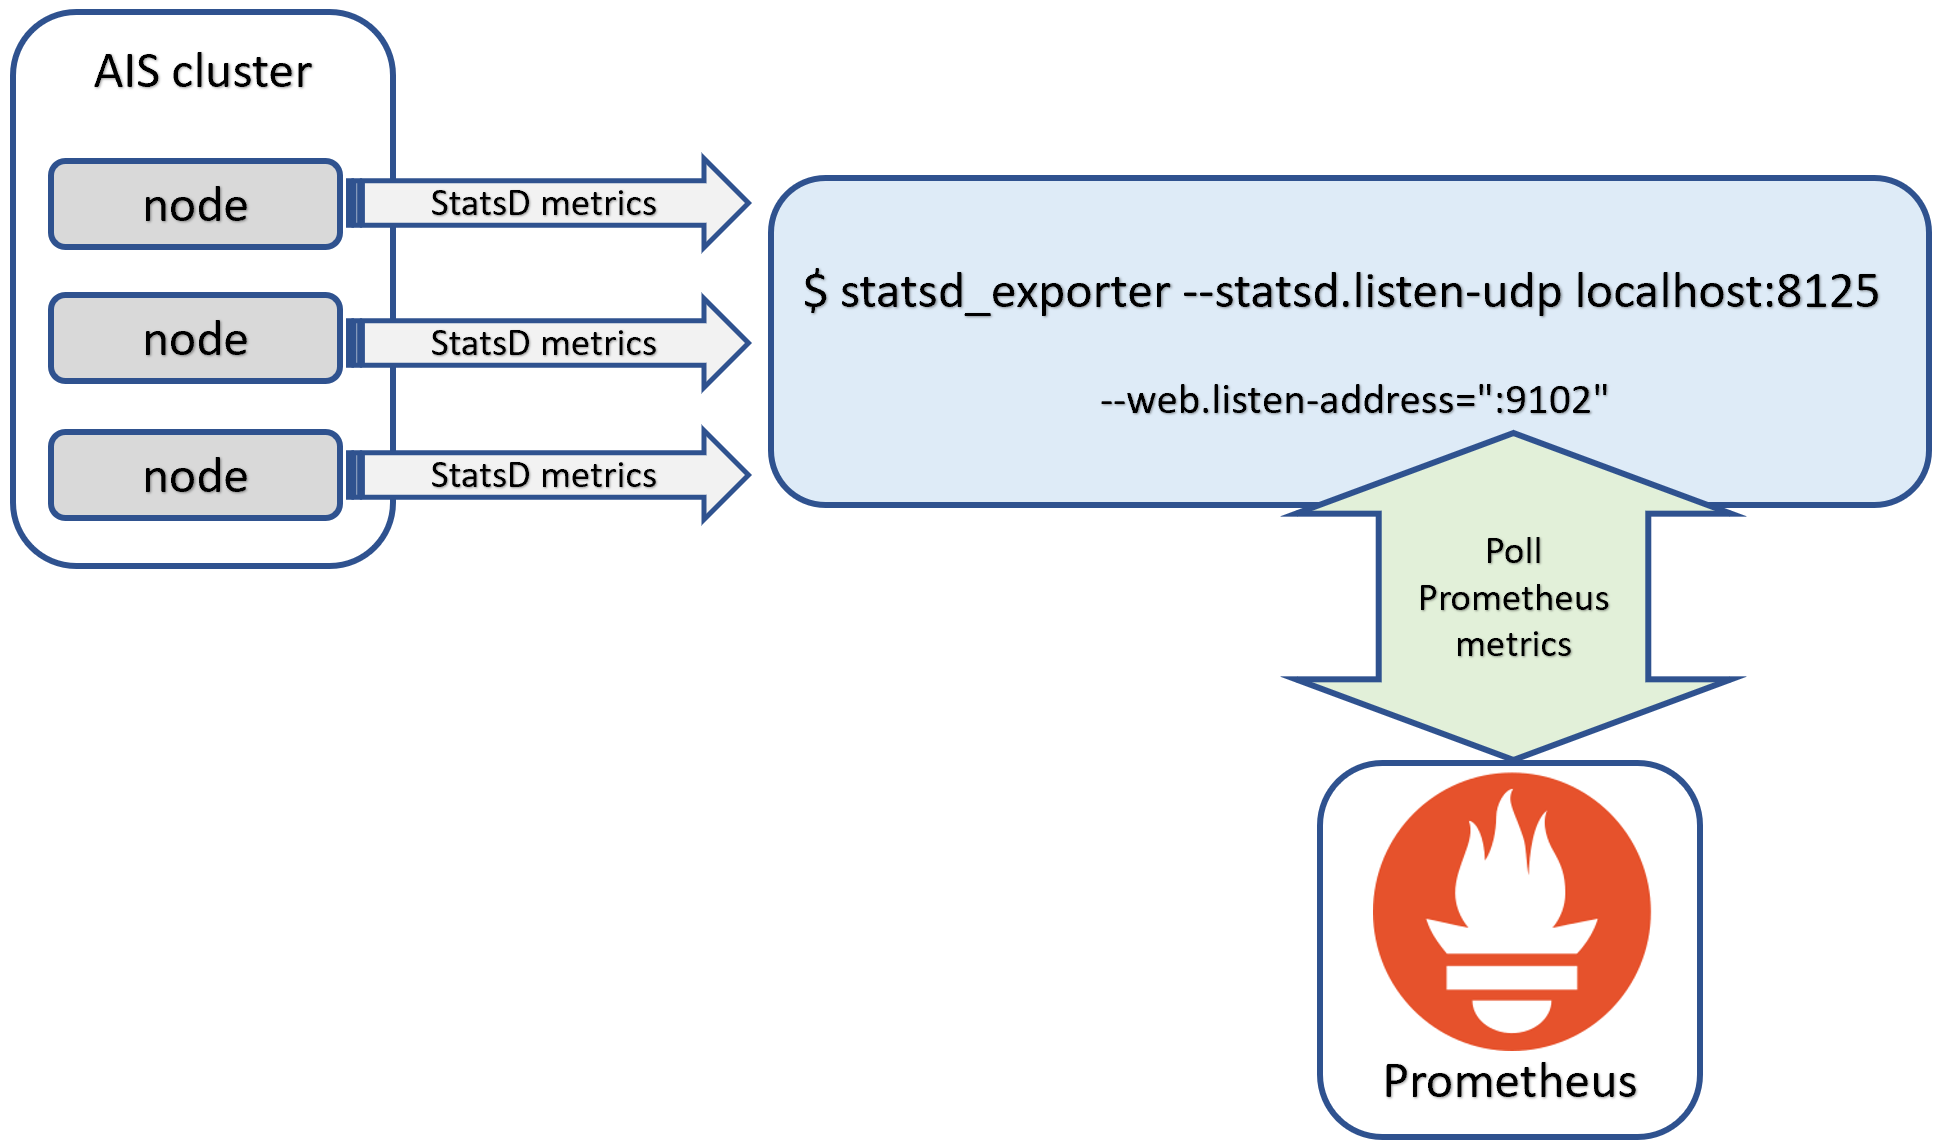
The diagram depicts AIS cluster that runs an arbitrary number of nodes with each node periodically sending its StatsD metrics to a configured UDP address of any compliant StatsD server. In fact, statsd_exporter is one such compliant StatsD server that happens to be available out of the box.
To deploy statsd_exporter:
- you could either use prebuilt container image;
- or,
git cloneorgo installthe exporter’s own repository at https://github.com/prometheus/statsd_exporter and then run it as shown above. Just take a note of the default StatsD port: 8125.
To test a combination of AIStore and statsd_exporter without Prometheus, run the exporter with debug:
$ statsd_exporter --statsd.listen-udp localhost:8125 --log.level debug
The resulting (debug) output will look something like:
level=info ts=2021-05-13T15:30:22.251Z caller=main.go:321 msg="Starting StatsD -> Prometheus Exporter" version="(version=, branch=, revision=)"
level=info ts=2021-05-13T15:30:22.251Z caller=main.go:322 msg="Build context" context="(go=go1.16.3, user=, date=)"
level=info ts=2021-05-13T15:30:22.251Z caller=main.go:361 msg="Accepting StatsD Traffic" udp=localhost:8125 tcp=:9125 unixgram=
level=info ts=2021-05-13T15:30:22.251Z caller=main.go:362 msg="Accepting Prometheus Requests" addr=:9102
level=debug ts=2021-05-13T15:30:27.811Z caller=listener.go:73 msg="Incoming line" proto=udp line=aistarget.pakftUgh.kalive.latency:1|ms
level=debug ts=2021-05-13T15:30:29.891Z caller=listener.go:73 msg="Incoming line" proto=udp line=aisproxy.qYyhpllR.pst.count:77|c
level=debug ts=2021-05-13T15:30:37.811Z caller=listener.go:73 msg="Incoming line" proto=udp line=aistarget.pakftUgh.kalive.latency:1|ms
level=debug ts=2021-05-13T15:30:39.892Z caller=listener.go:73 msg="Incoming line" proto=udp line=aisproxy.qYyhpllR.pst.count:78|c
level=debug ts=2021-05-13T15:30:47.811Z caller=listener.go:73 msg="Incoming line" proto=udp line=aistarget.pakftUgh.kalive.latency:1|ms
level=debug ts=2021-05-13T15:30:49.892Z caller=listener.go:73 msg="Incoming line" proto=udp line=aisproxy.qYyhpllR.pst.count:79|c
...
Finally, point any available Prometheus instance to poll the listening port - 9102 by default - of the exporter.
Note that the two listening ports mentioned - StatsD port 8125 and Prometheus port 9102 - are both configurable via the exporter’s command line. To see all supported options, run:
$ statsd_exporter --help